perf性能分析(6) -- perf实战(1) -- 分支预测
perf性能分析(6) -- perf实战(1) -- 分支预测
使用Debug模式编译 sort 和 unsort 代码:
1
2
3
4
5
6
7
8
9
10
11
12
13
14
15
16
17
18
19
20
21
22
23
24
25
#include <algorithm>
#include <ctime>
#include <iostream>

int main(int argc, char* argv[]) {
  constexpr int kArrLen = 1024 * 1024;
  int* data = new int[kArrLen];

  for (int c = 0; c < kArrLen; c++)
    data[c] = std::rand() % 256;

  // std::sort(data, data + kArrLen);  // 是否排序

  long long sum = 0;
  for (int i = 0; i < 30000; i++) {
    for (int c = 0; c < kArrLen; c++) {
      if (data[c] >= 128) {  // 故意選 256 一半
        sum += data[c];
      }
    }
  }

  delete[] data;
  std::cout << "sum = " << sum << std::endl;
}
1. sort/unsort 性能测试及比较: perf stat
The CPU is Intel(R) Core(TM) i5-8260U CPU @ 1.60GHz.
perf stat ./sort 测试结果:
1
2
3
4
5
6
7
8
9
10
11
12
13
14
15
16
17
18
19
$ perf stat ./sort

sum = 3016043160000

 Performance counter stats for './sort':

         63,995.28 msec task-clock                       #    1.000 CPUs utilized
             1,039      context-switches                 #   16.236 /sec
                 7      cpu-migrations                   #    0.109 /sec
             1,151      page-faults                      #   17.986 /sec
   240,342,649,070      cycles                           #    3.756 GHz
   473,524,864,500      instructions                     #    1.97  insn per cycle
    63,163,134,842      branches                         #  986.997 M/sec
         7,402,185      branch-misses                    #    0.01% of all branches

      64.008866998 seconds time elapsed

      63.983827000 seconds user
       0.010999000 seconds sys
perf stat ./unsort 测试结果:
1
2
3
4
5
6
7
8
9
10
11
12
13
14
15
16
17
18
19
$ perf stat ./unsort

sum = 3016043160000

 Performance counter stats for './unsort':

        206,441.99 msec task-clock                       #    1.000 CPUs utilized
               484      context-switches                 #    2.344 /sec
                44      cpu-migrations                   #    0.213 /sec
             1,150      page-faults                      #    5.571 /sec
   771,936,412,315      cycles                           #    3.739 GHz
   473,410,337,438      instructions                     #    0.61  insn per cycle
    63,144,272,701      branches                         #  305.869 M/sec
    15,732,825,641      branch-misses                    #   24.92% of all branches

     206.439026771 seconds time elapsed

     206.440760000 seconds user
       0.002000000 seconds sys
1.1. Result comparison
unsort的分支预测失败率为24.92%, 且CPU IPC为0.61, 小于1.0.
sort分支预测失败率为0.01%, CPU IPC为1.97.
2. analysis using perf record and perf ananotate
2.1. program unsort
运行 perf record 和 perf annotate 命令:
1
2
perf record ./unsort # 结束后生产 perf.data 文件
perf annotate        # 自动定位到最耗时的地方
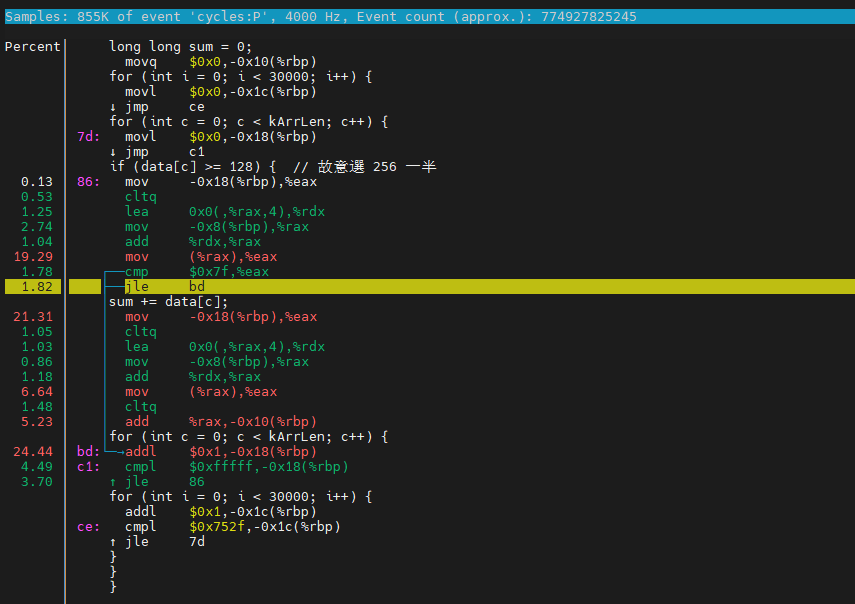
if语句比较失败跳转至循环体, 循环体占用24.44%的CPU时间. 原因是分支预测失败 – if语句在for循环中失败次数较多.
2.2. program sort
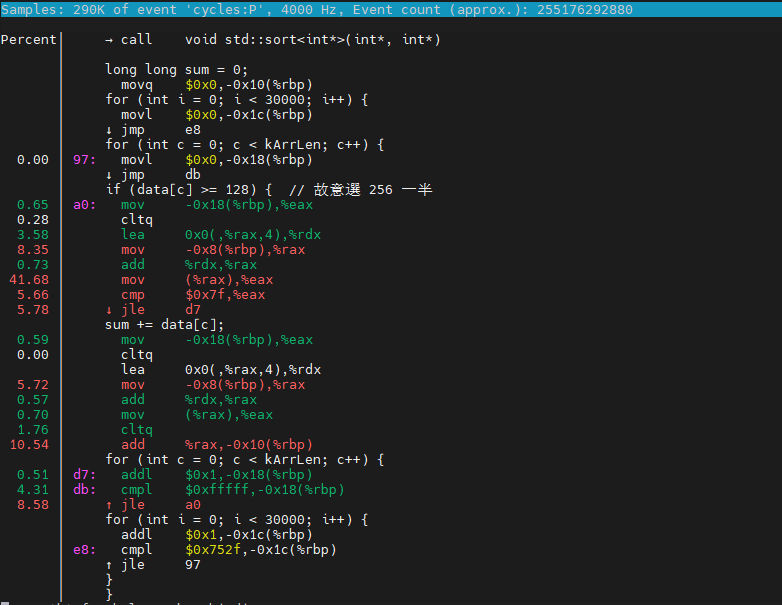
分支预测失败率为.051% + 4.31%, 且CPU IPC为1.97.
- 内存
load操作:41.68%. add指令:10.54%.
3. When build with Release
如果使用-O2或者-O3编译,编译器使用SIMD指令,且消除了if语句。其结果就是,sort与unsort的性能差距不大,甚至sort的性能更好:
pcmpgtd–SIMD比较指令,得到位掩码结果,存在结果寄存器中;pand–SIMD按bit进行and操作;
基本等效于:
1
sum += data[c] & -(data[c] >= 128);
references
- 在 Linux 上使用 Performance 做效能分析(入門篇)
- Category:Architecture/x86-assembly
- StackOverflow: Why is processing a sorted array faster than processing an unsorted array?
- StackOverflow: Why is processing an unsorted array the same speed as processing a sorted array with modern x86-64 clang?
- 知乎 – 分支对代码性能的影响和优化
- Modern Microprocessors – A 90-Minute Guide!
本文由作者按照 CC BY 4.0 进行授权